Priint Cache Integration
Configuring access to the Priint Cache service (Hazelcast or Redis) for Caching SDK
- By default, the embedded Hazelcast Instance in Payara will be used and nothing needs to be configured (default configuration)
- To configure an external Caching go to <domain_folder>/config/Cache directory, create it if it does not exist.
- Edit or create the config.xml file.
- The default configuration is:
<priintCacheConfiguration>
    <endpoint>localhost:40049</endpoint>
    <name>development</name>
    <type>payara</type>
    <accessKey></accessKey>
    <secretKey></secretKey>
</priintCacheConfiguration>
endpoint- Cache server address (default: "localhost:40049")name- Name of the Caching Instance (default: "development")type- "payara" (default),"hazelcast" or "redis"accessKey- username (default: empty)secretKey: Secret key used for authentication/authorization when connecting to the service. The value can be provided either directly (legacy mode) or as a placeholder in the${property.name}form, which will be resolved dynamically via MicroProfile Config (e.g., from environment variables, JVM system properties-D..., or secret sources integrated into Payara).- Recommended: use a placeholder to avoid storing secrets in plain text inside XML files.
- Syntax:
${property.name}(simple key only; no default values and no nested placeholders). - Backward compatibility: if the value does not match the
${...}pattern, it is treated as a legacy plain-text secret and used as-is. - Missing key in MicroProfile Config: the system logs a warning and falls back to the raw value (to preserve compatibility with existing setups).
Example configuration to use external Hazelcast
<priintCacheConfiguration>
	<endpoint>localhost:5701</endpoint>
	<name>dev</name>
	<type>hazelcast</type>
	<accessKey/>
	<secretKey/>
</priintCacheConfiguration>
Example configuration to use external Redis
<priintCacheConfiguration>
	<endpoint>redis://localhost:6379</endpoint>
	<name>dev</name>
	<type>redis</type>
	<accessKey/>
	<secretKey/>
</priintCacheConfiguration>
Use Priint Cache Service in your Code
// get an Instance of Priint Cache Manager
PriintCacheServiceLocal service = PlannerEngineServiceLocator.INSTANCE.getPriintCacheServiceLocal(); // obtain reference to the service
PriintCacheManager cacheManager = service.getPriintCacheManager();

// create your Cache "pubserver.myCache"
// choose Type for key ("String" used here) and value ("Object" used here)
PriintCache<String, Object> myCache = cacheManager.createCache("pubserver.myCache", Object.class);

// put a key "myKey" with value "myValue" and a key "myKey2" with "myValue2"
// and time to live (TTL) 10 seconds

myCache.put("myKey","myValue");
myCache.put("myKey2","myValue2", 10, TimeUnit.SECONDS);
myCache.remove("myKey2");

// check if "myKey2" is in the cache
myCache.containsKey("myKey2") {
    myCache.remove("myKey2");
}
// try to get "myKey3" (will be null)
Object myValue3 = myCache.get("myKey3");

// remove your cache "pubserver.myCache"
if (cacheManager.cacheExists("pubserver.myCache")) {
    cacheManager.removeCache("pubserver.myCache);
}
Configure Priint Cache Service in ISON
- Open the Entity Explorer
- Select your project and then the entity model
- Locate your desired entity
- Right-click to open the context menu
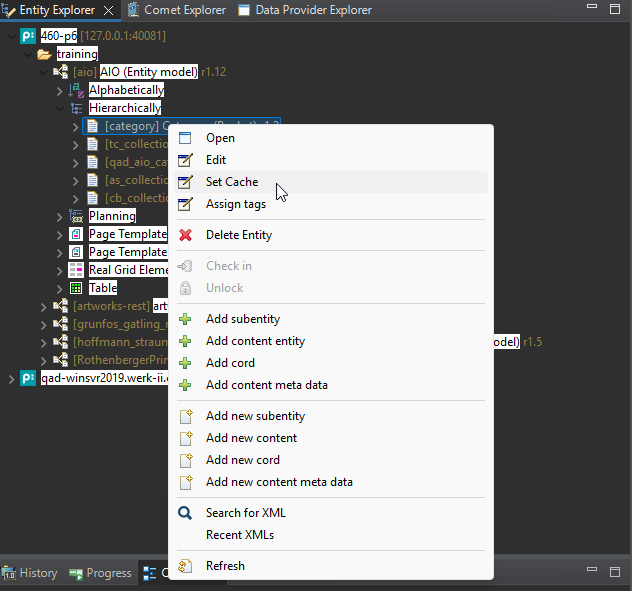
- Click on Set Cache

- In the Set Cache dialog:
- Choose Allowed
- Set the entity's cache lifetime (in hours and minutes)
- Click OK
How to use Hazelcast Management Center
Download Hazelcast
For the current release we support Hazelcast v5.
You can download it from https://hazelcast.com/community-edition-projects/downloads/
How to run Hazelcast
- Unzip the downloaded file
- Open a command prompt and navigate to the
bindirectory of the unzipped folder - Run the following command to start Hazelcast:
hz-start.bat
Then you should run Hazelcast Management Center
How to start Hazelcast Management Center
Start the Management Center
- Open a command prompt and navigate to the
bindirectory of the unzipped folder - Run the following command to start Hazelcast Management Center f.e.
java -jar hazelcast-management-center-5.5.0.jar
After a few seconds, it should say something like: Hazelcast Management Center started at http://localhost:8080
How work the entity model cache?
This section outlines the caching behavior for entities and other data.
Declaring Entities to Be Cached
Entities that should be cached must be explicitly declared in the ISON configuration.
Caching Buckets Containing a Cache-Enabled Entity
All buckets that contain at least one entity marked as cached will be added to the cache.
The time-to-live (TTL) is defined individually per entry — it can be a fixed duration or infinite (TTL = 0).
Caching Buckets
Buckets are cached only if all entities for given model entities returned by a connector are configured for caching.
This means that caching depends on the complete set of entities used in the model, not just the individual bucket.
Example:
Assume there are 6 root buckets:
- 2 contain the entity
Product - 2 contain
Category - 2 contain
Price
So, the union of all root bucket entities is: Product, Category, Price.
- If all three entities are marked as cached → all 6 root buckets will be cached.
- If any one of them (e.g.,
Product) is not cached → none of the root buckets will be cached.
Cache Entry Removal
Entries in the cache are removed automatically based on their configured TTL.
If immediate removal or full cache clearing is required, there are two options:
-
For external cache systems (e.g., a dedicated Hazelcast cluster):
Individual entries can be deleted, or the cache instance can be restarted. -
For embedded Hazelcast within Payara:
The cache can be restarted via the Payara admin console using the command:
restart-hazelcast
Caching Custom (Non-Entity) Data
It’s also possible to cache arbitrary data (e.g., planning data), not just buckets.
There are two ways to do this:
-
Via Camunda BPM process –
The process “Fill the cache with custom TTL” allows storing any data with a specified time-to-live. It works with Publications. -
Programmatically –
You can use the Priint Cache Service directly in your code.
See the section "Use Priint Cache Service in your Code" in the documentation for how to manually put data into the cache with a defined TTL.
When to use entity model cache?
Entity model caching is useful when your application works with large amounts of frequently accessed data and you want to improve performance by reducing database load and network latency.
Typical use cases include:
- Rendering – when rendering processes need to access large volumes of structured data quickly
- Planning – when planning workflows require downloading data from external services, and network or database access becomes a bottleneck
When not to use the entity model cache?
Avoid using the entity model cache in scenarios where data consistency and freshness are critical, or where changes bypass the cache mechanism. Examples include:
- Import processes – when importing data directly into the publishing hub database without a cleanup or cache invalidation step. The cache will not reflect the latest data, which can lead to inconsistencies.
- Content editing in UI applications – when using the content module in the Admin or priint:data-management application. These tools require immediate access to up-to-date data, which the cache cannot guarantee.
- Manual database edits or imports – when making direct changes to the database (e.g. through SQL scripts or maintenance jobs). These changes will not be visible in the cache unless it is explicitly cleared.
How to use monitor the entity model cache (with Hazelcast)?
Hazelcast provides detailed statistics for IMap data structures. These metrics are grouped into:
- Map Statistics – current state of the map (entry count, operations, memory, events, latency),
- Map Throughput Statistics – operation rates per second (ops/sec).
You can access them via:
- Hazelcast Management Center (
Maps → Your Map)
Map Statistics
| Metric | Description |
|---|---|
| Entries | Number of entries (key–value pairs) stored locally on a given member. Helps estimate map size. |
| Entry Memory | Memory usage of local entries (e.g., 92.81 KB for 213 entries). |
| Gets | Total number of get() operations executed by this member. |
| Puts | Total number of put() operations – insert or update. |
| Removals | Total number of remove() operations – manual deletion. |
| Sets | Total number of set() operations – similar to put() but more efficient when no return is needed. |
| Hits | Number of successful get() hits – indicates how often entries are found locally. |
| Events | Number of map events (entryAdded, entryUpdated, entryRemoved, entryEvicted, etc.). |
| Get/Put/Remove Latency | Average time in milliseconds to complete each respective operation. |
Map Throughput Statistics (ops/sec)
These metrics show how many operations per second are executed on a given map, allowing real-time performance monitoring.
| Metric | Description |
|---|---|
| Get Throughput | Number of get() operations per second – read activity. |
| Put Throughput | Number of put() operations per second – write/update activity. |
| Set Throughput | Number of set() operations per second – optimized updates without return values. |
| Remove Throughput | Number of remove() operations per second – standard deletions. |
| Delete Throughput | Number of delete() operations per second – deletions without returning values. |
| Evict Throughput | Number of evict() operations per second – entry evictions via eviction API. |
| Other Operation Throughput | Rate of all other operations (e.g., containsKey, size, executeOnKey, etc.). |
| Total Operation Throughput | Total number of all operations per second – overall map activity rate. |
When Metrics May Be Concerning
| Observation | Possible Cause or Interpretation |
|---|---|
| Entries constantly increasing | Time-to-live (TTL) or eviction policy is not configured, causing unbounded growth. |
| Low Hits with high Gets | Ineffective caching – data may be evicted too quickly, TTL is too short, or entries are rarely reused. |
| High Entry Memory usage | Map contains large object payloads or entry count is growing without limits. |
| High Puts with low Entries | Same entries are being updated frequently – could indicate unnecessary writes or update loops. |
| High Get/Put/Remove Latency | Performance degradation – possibly due to network issues, garbage collection pauses, I/O blocking (e.g., with MapStore), or large serialized objects. |
| No Expirations despite TTL | TTL may not be applied correctly, or entries are overwritten before expiration occurs. |
| Very high Events count | Indicates very dynamic data – might increase load on systems using event listeners. |
| Sudden drop in Total Throughput | Could signal a system slowdown, GC pause, member disconnect, or internal exception. |
| High Other Operation Throughput | Heavy use of complex or expensive operations like executeOnEntries, containsKey, or map scans. |
| Frequent Evict/Delete throughput spikes | May indicate aggressive manual cleanup or memory pressure triggering eviction logic. |
| Disproportionate Put vs Get throughput | Potential misuse of map as a storage-only layer without leveraging it as a cache. |
Practical Tips
- Always configure
TTLorEviction Policyfor maps that could grow indefinitely. - Regularly check
Hit Ratio(Hits / Gets). If below 50%, reconsider caching strategy. - Monitor
Latencymetrics if users report delays. - Use
Throughputstats to detect sudden traffic changes, performance regressions, or memory pressure.
Based on Hazelcast Management Center 5.5 Documentation
https://docs.hazelcast.com/management-center/5.5/data-structures/map