1. Introduction
This documentation aims to guide the user through the process of configuring Prometheus and Grafana to monitor applications running on the application server Payara or other applications. Environment description:
- Application server: https://localhost:40081
- Prometheus: http://localhost:9090
- Grafana: http://localhost:3000
- Applications: PlannerEngine, Priint-bpm, Rendering-service, PubServerEntityManager
2. Prerequisites
Environment description:
- Operating System: Windows 11 (tested) Required software and versions:
- Prometheus 2.53.0+
- Grafana 11.1.0+
3. Installing and Configuring Prometheus
Downloading and Installing Prometheus:
- Download Prometheus from the project website. https://prometheus.io/download/
- Unpack the downloaded file to the chosen location. https://grafana.com/grafana/download
Configuring the prometheus.yml file:
- Open the
prometheus.ymlfile. - Add the configuration for Priint-bpm, Rendering-service, and Payara:
scrape_configs:
  - job_name: 'priint-bpm'
    metrics_path: '/actuator/prometheus'
    scrape_interval: 5s
    static_configs:
    - targets: ['localhost:8888']
  - job_name: 'rendering-service'
    metrics_path: '/actuator/prometheus'
    scrape_interval: 5s
    static_configs:
    - targets: ['localhost:8880']
  - job_name: 'payara6'
    metrics_path: '/metrics'
    scrape_interval: 5s
    scheme: https
    tls_config:
        insecure_skip_verify: true
    static_configs:
    - targets: ['localhost:40081']
Starting Prometheus:
- Navigate to the directory where the
prometheus.ymlfile is located. - Start Prometheus by typing in the terminal:
prometheus.exe --config.file=prometheus.yml --storage.tsdb.retention.time=14d --storage.tsdb.retention.size=200MB
storage.tsdb.retention.time– retention timestorage.tsdb.retention.size– retention data size
Prometheus should be accessible at http://localhost:9090.
Installing and Configuring Grafana
Downloading and Installing Grafana:
- Download Grafana from the official website.
- Run the installer and install Grafana by following the instructions.
Basic Grafana Configuration:
- Start Grafana by typing in the terminal (for Windows):
Grafana should be accessible at http://localhost:3000.
bin\grafana-server.exe - Log in to Grafana using the default login credentials:
- Username: admin
- Password: admin
- After logging in, you will be prompted to change the password. You do not need to do this.
Adding Prometheus as a Data Source:
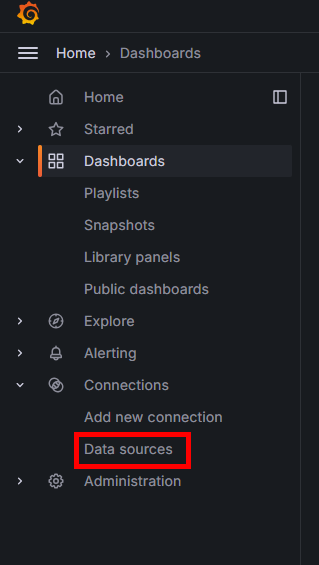
- In the left sidebar menu, click on "Data Sources".
- Click "Add data source".
- Select "Prometheus" from the list of available data sources.
- In the "Prometheus server URL" field, enter http://localhost:9090.
- Click "Save & Test" to ensure Grafana can connect to Prometheus.
Configuring priint-bpm and rendering-service
This is already done. Here is shown how it was configured. It can be used for adding new metrics for other applications.
Adding Dependencies in build.gradle:
- In the
build.gradlefile for Priint-bpm and Rendering-service, add the following dependencies:implementation group: 'io.micrometer', name: 'micrometer-registry-prometheus'
Configuring the application.yml file:
- In the
application.ymlfile for Priint-bpm and Rendering-service, add the following configuration for Prometheus:management:
endpoints:
web:
exposure:
include: health, prometheus
Configuring Payara
It is already done. Here is shown how it was configured. It can be used for adding new metrics for other Payara applications or to configure a Payara server.
Enabling Metrics in Payara:
- In the Payara administrative console, navigate to "Configurations" -> "server-config" -> "Monitoring".
- In the "Monitoring Service" section, ensure that monitoring is enabled.
Configuration Verification
Checking Metrics in Prometheus:
- Navigate to Prometheus at http://localhost:9090.
- In the search field, type
upand click "Execute" to ensure Prometheus is collecting metrics from the defined sources.
Creating Custom Metrics in Deployed Applications in Payara
Simple example of adding a new custom metrics to existing implementation of deployed applications in Payara.
Add Dependencies to build.gradle in PlannerEngine:
implementation 'org.eclipse.microprofile.metrics:microprofile-metrics-api:5.1.1'
Example Metric for an Endpoint:
@Path("")
public class SomeController {
    @Inject @Metric Counter documentsCounter;
    private int val = 0;
    @GET
    @Path("someCalcs")
    @Timed(name = "customTimer", description = "Execution time of someCalcs")
    @Counted(name = "customCounter", description = "Counter for endpoint: someCalcs")
    @Metered(name = "customMeter", description = "Meter for someCalcs")
    public void someCalcs() {
        //Implementation…
        documentsCounter.inc(1);
    }
    @Gauge(name = "customGauge", unit = "none", description = "Gauge...")
    public int getVal() {
        return val;
    }
}
@Timed: Measures the execution time of a method.
@Counted: Counts the number of method invocations.
@Metered: Measures the rate of method invocations.
@Gauge: Measures the current state of a variable.
Creating a New Dashboard from Templates Available in Grafana
- Click on Dashboard:
- Go to the main Grafana panel and click on the "Dashboard" section in the left sidebar menu.
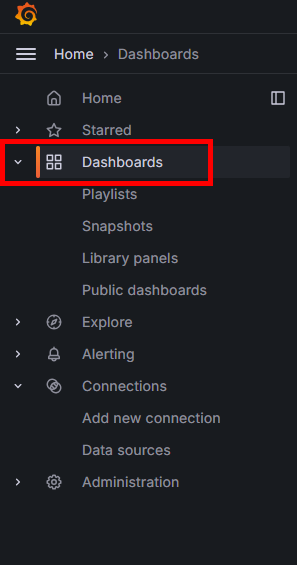
- Go to the main Grafana panel and click on the "Dashboard" section in the left sidebar menu.
- Click New, then Import:
- Click on the "+" (Create) icon in the left sidebar menu.
- In the expanded menu, select "Import".

- Go to the Grafana website:
- Open a new browser tab and go to the Grafana website. https://grafana.com/grafana/dashboards/
- Download the dashboard:
- Search for the appropriate dashboard on the Grafana website that meets your needs.
- Download the JSON file of the selected dashboard to your computer.
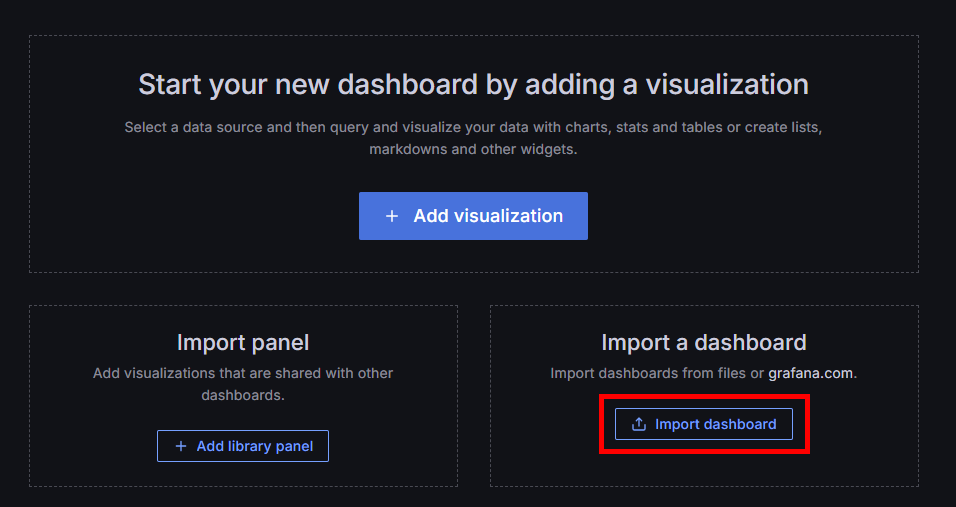
- Click Import:
- Return to the Grafana window and click the "Import dashboard" button on the import page.
- Select the JSON file of the downloaded dashboard.
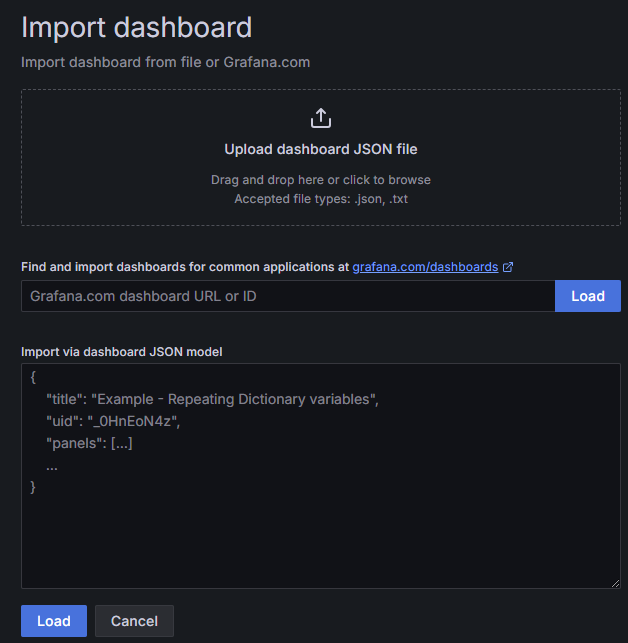
- Select the data source and location to save:
- After uploading the JSON file, Grafana will display a preview of the dashboard configuration.
- Select the appropriate data source (e.g., Prometheus) and the folder where the dashboard should be saved.
- Save:
- Click the "Import" button at the bottom of the page to complete the import process.
- The new dashboard will be available in the selected folder and ready to use.
Example of Creating a Histogram
Note: The example will not work if you do not have the necessary metrics in Prometheus. Check available metrics, f.e. at localhost:8880/actuator/prometheus
To create a histogram in Grafana using execution time metrics from Prometheus, follow these steps:
- Create a new dashboard or use existing one:
- Create a new visualization:
- In the top panel click on "Add" then Visualization.
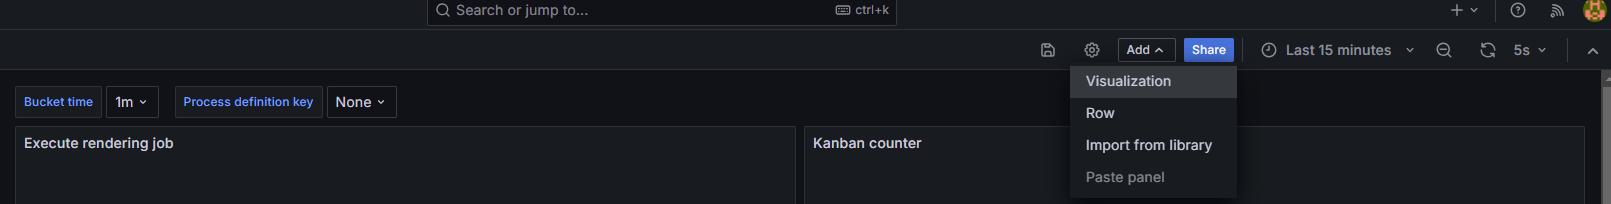
- In the top panel click on "Add" then Visualization.
- Choose Bar gauge:
- In the "Visualization" section, select the "Bar gauge" type of visualization.
- Select the data unit:
- In the "Unit" field, select the appropriate data unit, e.g., "seconds" for execution time metrics.
- Complete the legend for the X/Y axes:
- Set appropriate labels for the X and Y axes, which will describe the data on the chart.
- Example metric:
- Go to the "Queries" tab and enter the query for the 0.5 quantile metric:
application_com_priint_pubserver_engine_rest_kanban_KanbanDocumentController_customTimer_seconds{quantile="0.5"} - Add additional metrics for other quantiles:
- To add more quantiles, add additional queries in the "Queries" section for the metrics:
application_com_priint_pubserver_engine_rest_kanban_KanbanDocumentController_customTimer_seconds{quantile="0.75"}
application_com_priint_pubserver_engine_rest_kanban_KanbanDocumentController_customTimer_seconds{quantile="0.95"}
application_com_priint_pubserver_engine_rest_kanban_KanbanDocumentController_customTimer_seconds{quantile="0.98"}
application_com_priint_pubserver_engine_rest_kanban_KanbanDocumentController_customTimer_seconds{quantile="0.99"}
application_com_priint_pubserver_engine_rest_kanban_KanbanDocumentController_customTimer_seconds{quantile="0.999"} - Save and run:
- After adding all the metrics and configuring the panel, click the "Apply" button in the upper right corner.
- Then click "Save dashboard" in the upper right corner to save the new dashboard.
- Name your dashboard and click "Save".
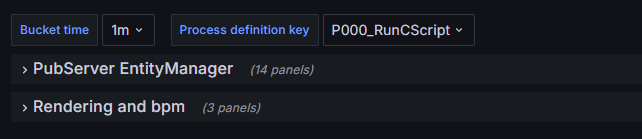
Example Metrics Included in Imported Dashboards
Please import the provided dashboards download time executions, rendering and priint bpm and payara . Please note you will need to change datasource uid (please check the real uid of prometheus datasource in Grafana) in the JSON before importing (it appears in the dashboard several times). Dashboard will be available in the Grafana dashboard list called Time Executions, which consist of two groups.
To import the dashboard, follow the steps outlined in the previous section.
Data will be available when the worker is running and executing tasks and some process is already finished.
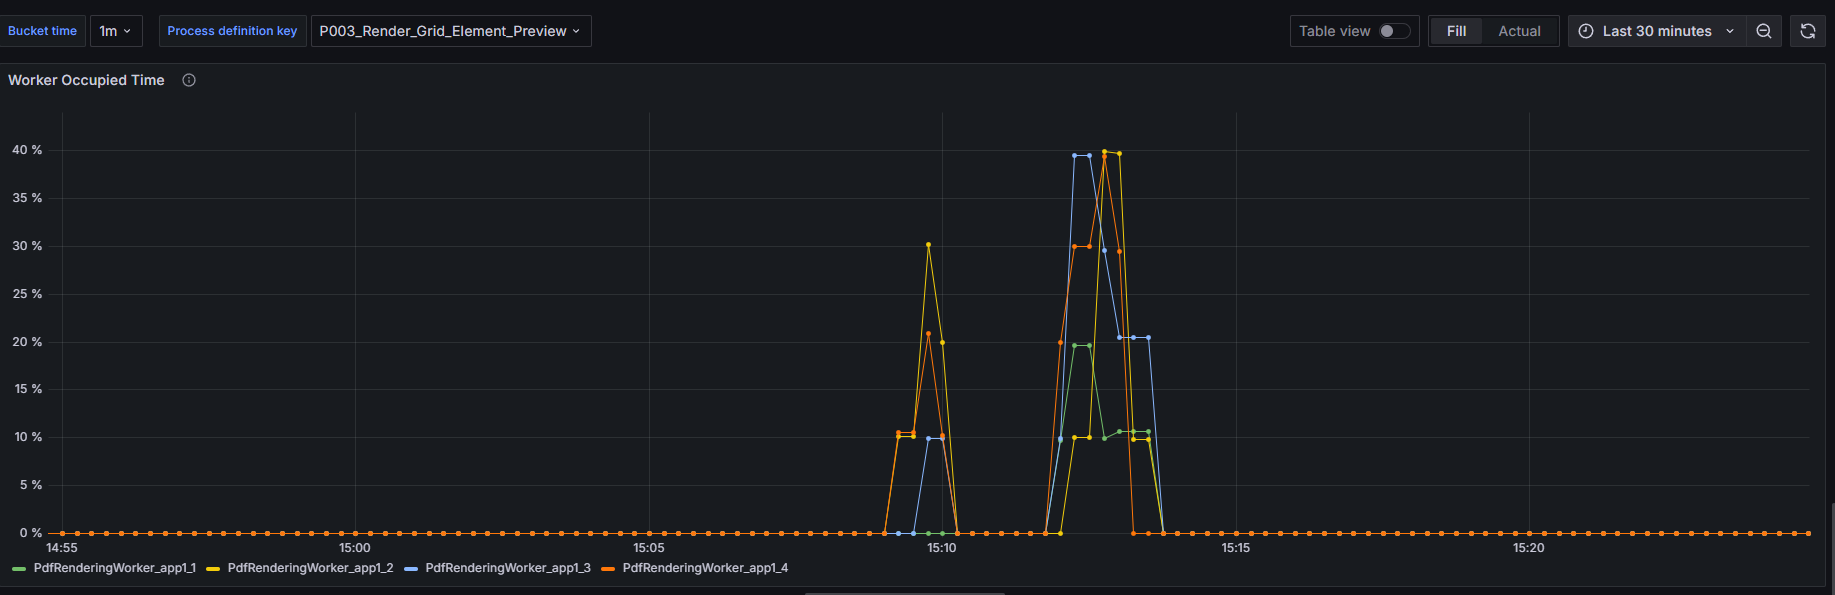
Worker Occupied Time
Measures the percentage of time each worker is occupied with tasks since the start of the server. A higher percentage indicates more time spent in the BUSY state relative to the total uptime.
Configuration in Grafana
The dashboard includes a bucket setup with time periods ranging from 1 minute up to 24 hours. This allows you to view the worker occupied time metric over different durations to analyze performance trends.
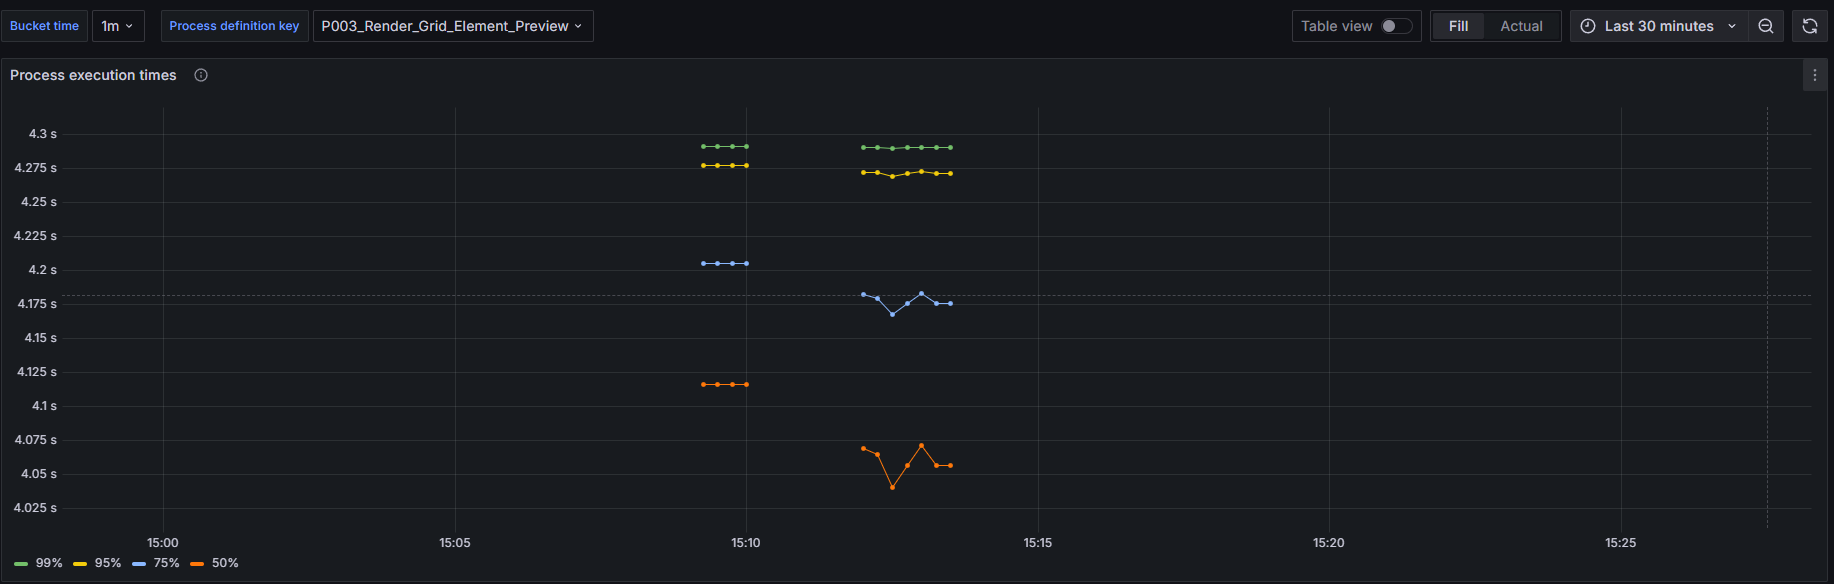
Process Execution Times
This metric visualizes rendering job execution times, grouped by process definition keys, and shows the 99th, 95th, 75th, and 50th (median) percentiles. It helps identify performance patterns and bottlenecks in rendering processes.
Configuration in application.yml
To enable and configure the Process Execution Times metric, update the application.yml file for the rendering service as follows:
management:
  metrics:
    distribution:
      percentiles-histogram:
        "rendering.service.timer": true
#      minimum-expected-value:
#        "rendering.service.timer": 100
#      maximum-expected-value:
#        "rendering.service.timer": 10000
By default, the maximum tracking time is set to 30 seconds. If you need to change this, update the maximum-expected-value configuration:
management:
  metrics:
    distribution:
      percentiles-histogram:
        "rendering.service.timer": true
      maximum-expected-value:
        "rendering.service.timer": <desired_value_in_milliseconds>
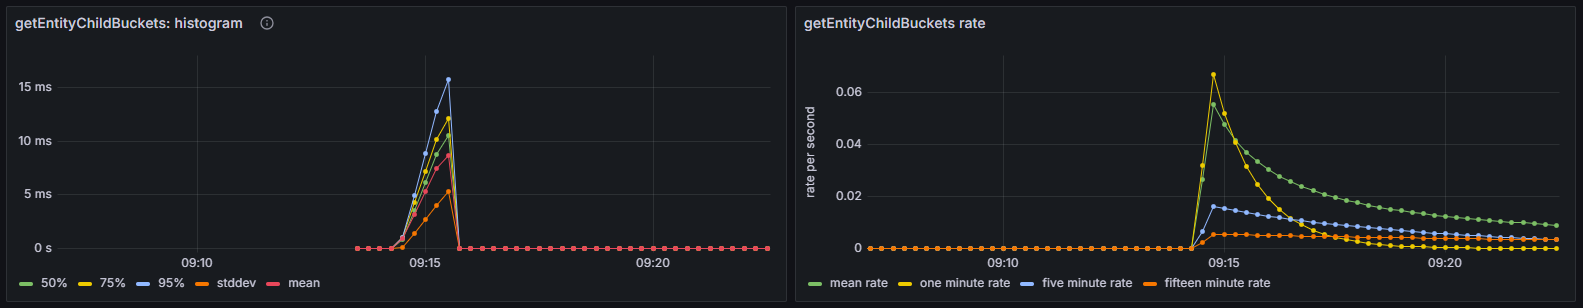
PubserverEntityManager Metrics
On the left part chart below, which shows a histogram, where we present the 50%, 75%, and 95% percentiles of the average request times over a specific period for a particular method. For example, if the 50% percentile is 1.5 seconds over 1 minute, this means that, on average of 1 minute period, 50% of the requests take less than 1.5 seconds.
Additionally, we measure the mean value and its standard deviation.
On the right side of the Fig. 1 is shown mean, one-, five- and fifteen-minutes rate (number of executions)